This article describes all the properties and channels of the Datasources
The following sections correspond with the order they appear on the Datasource page.
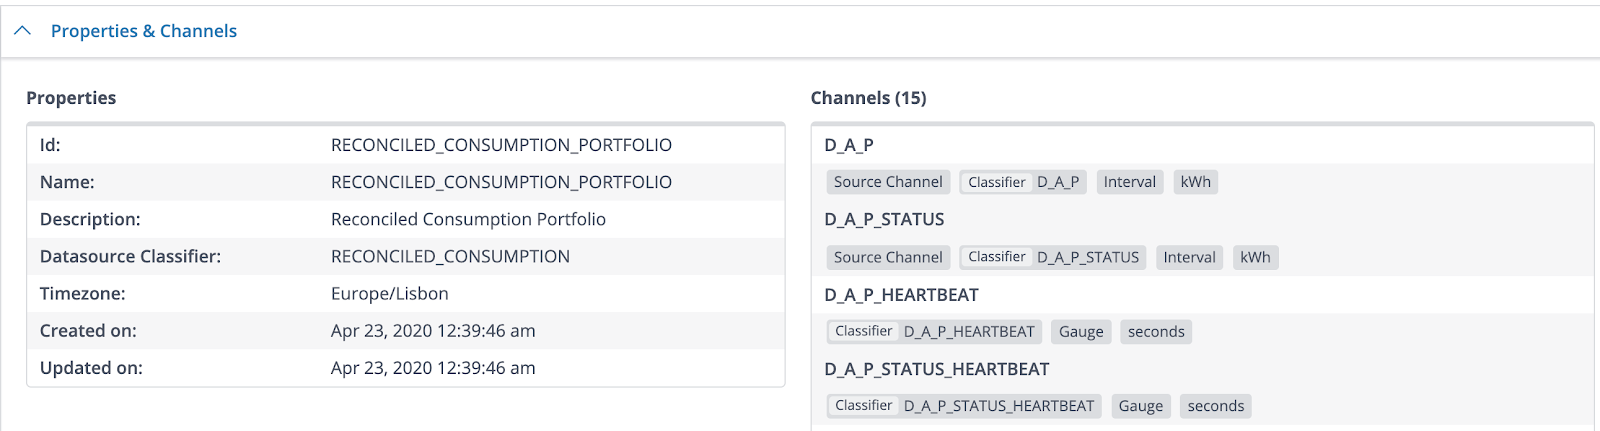
Properties & Channels
This section displays an overview of all the properties belonging to the Datasource. Expect information such as the timezone and the creation date to be found here.
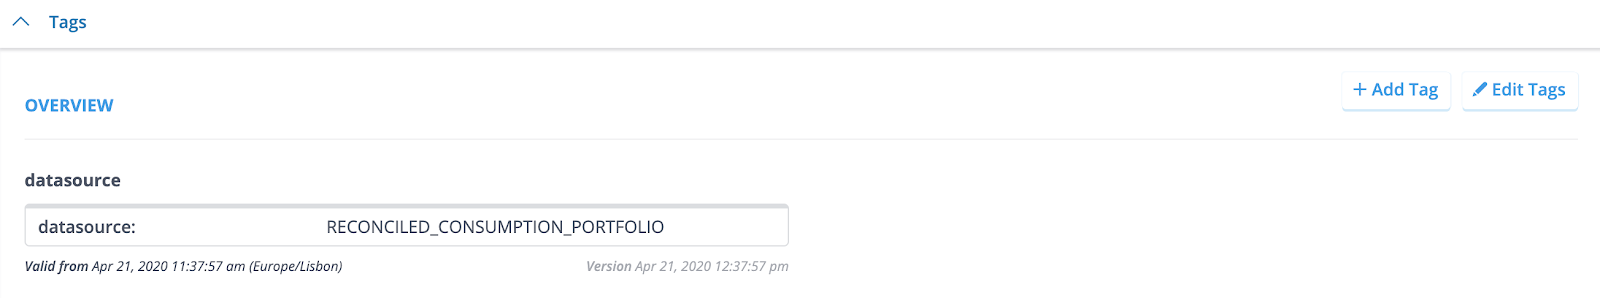
Tags
This section displays an overview of all the tags of the Datasource. For instance, metadata, geopoint and transactioninfo. This section also enables you to add or edit tags for this Datasource.
For adding Tags:
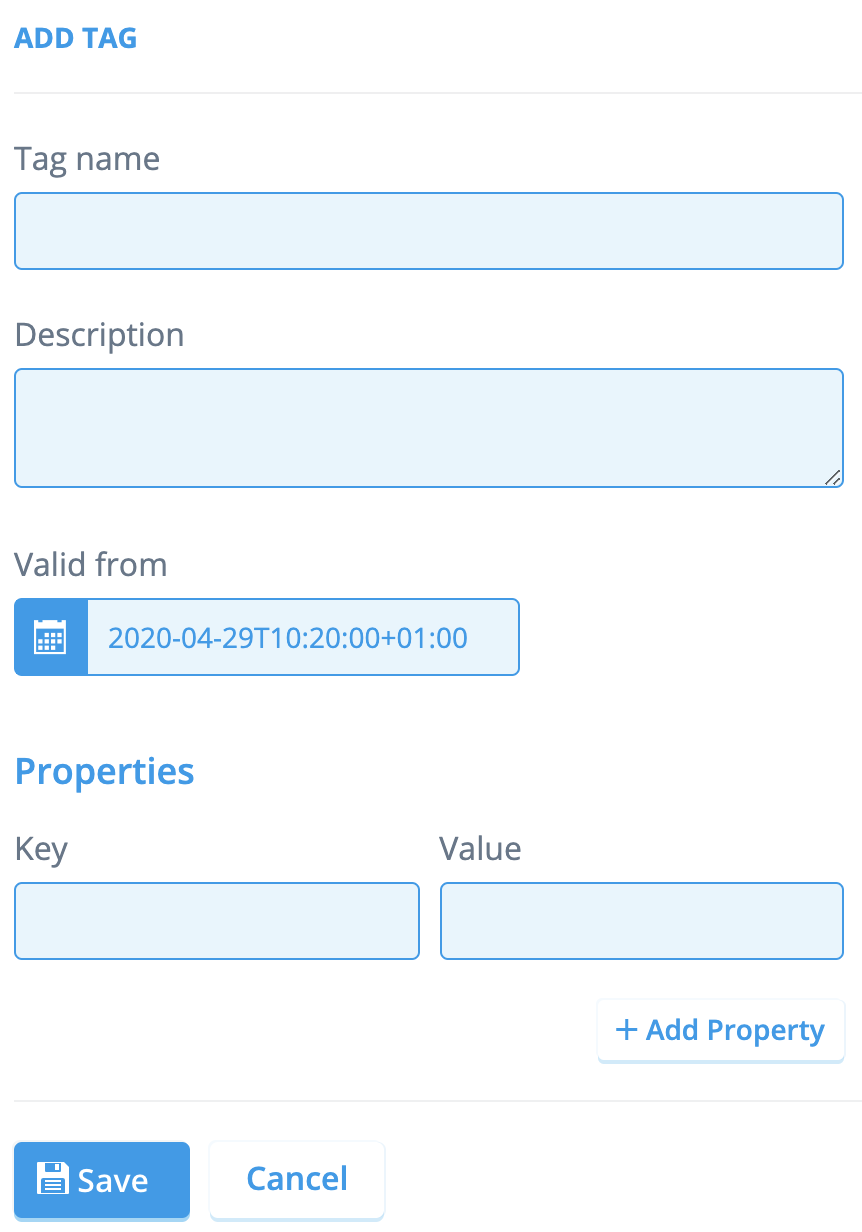
- Click the [+ Add Tag] button. A new segment will appear.
- Fill in the Tag name field (mandatory).
- Fill in the Description field (optional).
- Set the [Valid from] date and time by clicking the calendar icon. First you select the year, then the month, then the day, and lastly, the time.
Working with Dates
It’s possible to select a date and time in the past. The calendar is also pre-set to the Datasources timezone property. In case this needs to be changed, simply click the Change hyperlink in the calendar and select a timezone by using the dropdown menu.
5. Fill in the Key and Value fields to add a property. When more properties are needed, simply click the [+ Add Property] button.
6. Click [Save] when ready.
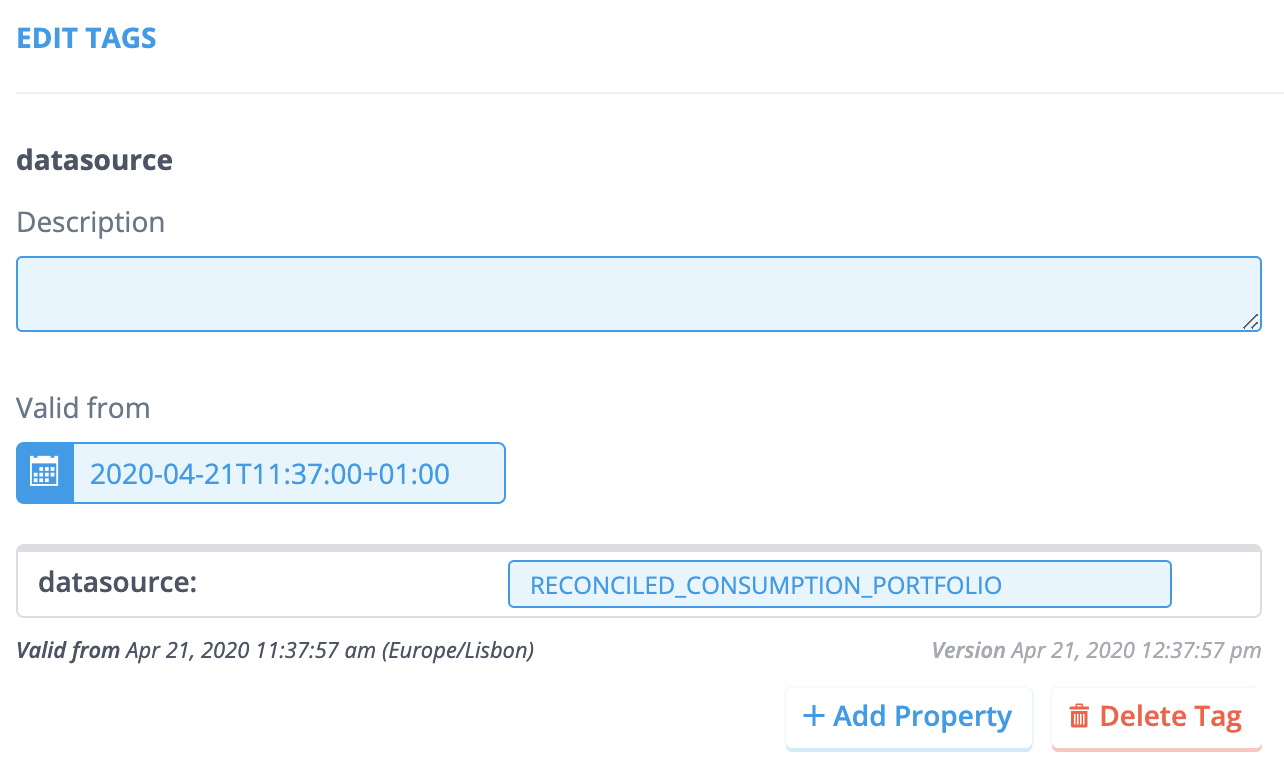
For editing Tags:
- Click the [Edit Tags] button. All the available fields can now be edited. For instance, Valid from dates, Description fields or Values.
- Use the [Add Property] buttons to add more Properties.
- Use the [Delete] buttons or bin icons to remove Tags.
- Click [Save] when you’re done.
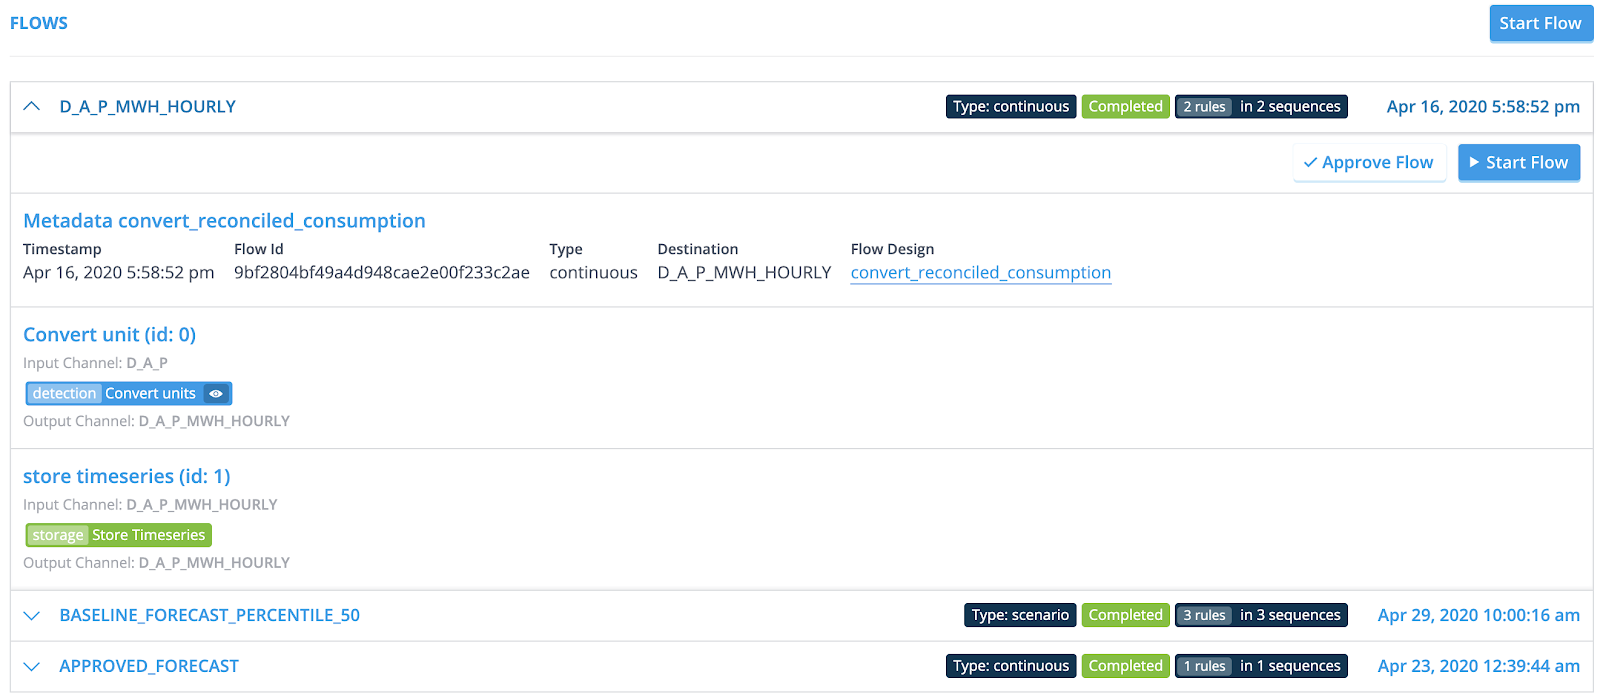
Flows
This section displays an overview of the output that the Flow Designs have generated for this Datasource. The overview is broken down into all the sequences the flow consists of.
Hover over a sequence to see its details.
- Click the Flow Configuration hyperlink to be redirected to the configuration page of the Flow Design that delivered this output.
- Click the [Custom Flow] to create a new Flow Design. You are redirected to the Flow Design configuration page, where a copy of the current Flow Design is already in place.
- Click [Start Flow] to run a flow manually.
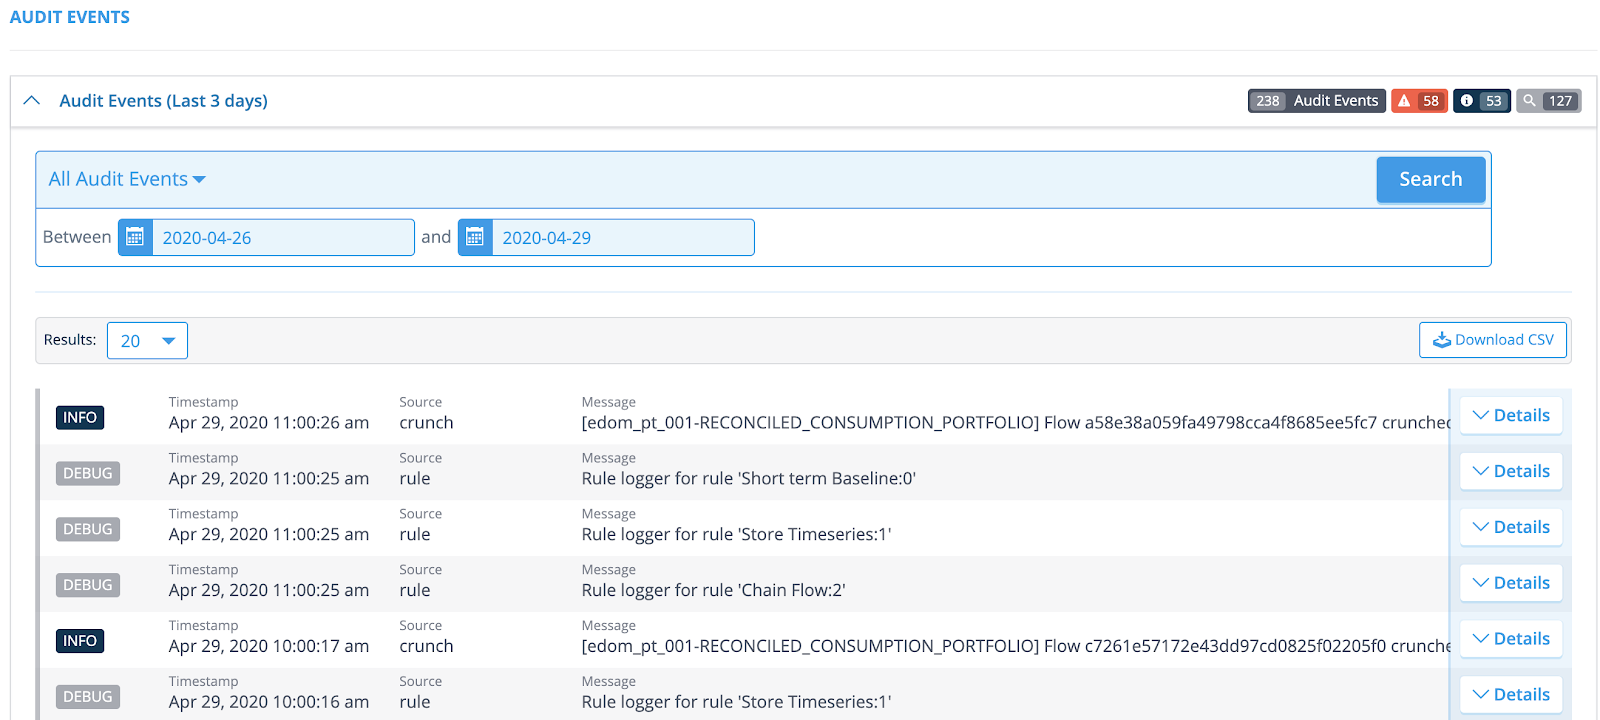
Audit Events
This section displays all the Audit Events per run Flow.
Audit events contain both system events providing information about the platform status as well as compliance and security message as an audit trail of users actions in the platform
Use the dropdown menu to narrow down your search in the events (Choose between the ERROR, WARNING, INFO and DEBUG categories).
Click the [Details] button of the event you’re investigating. A new section will expand, which always contains a Details and a Subjects section. The Details section displays a Message, which provides information on the status (For instance, in the INFO category you can expect information on a successful ingestion. In the WARNING category you can expect information on why an action failed).
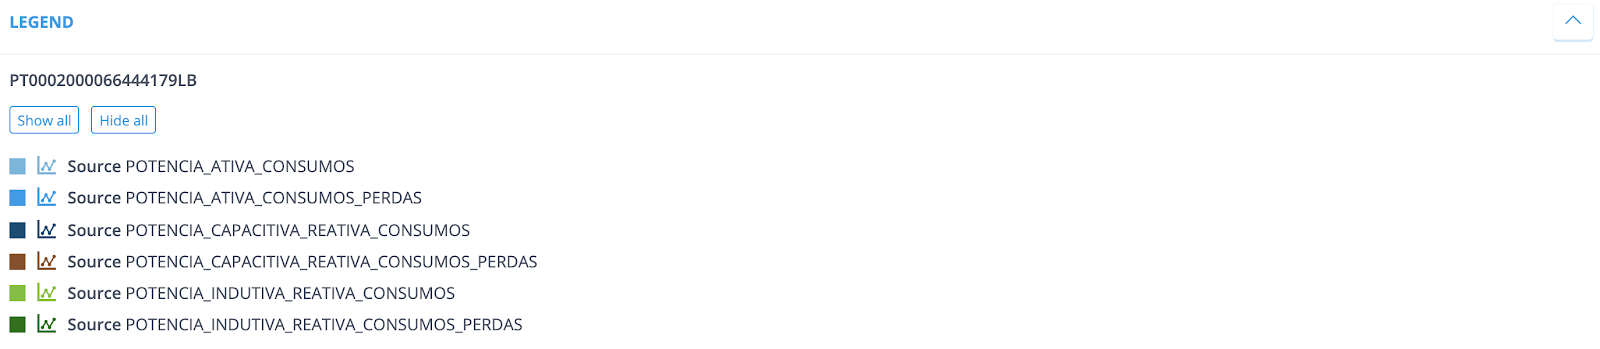
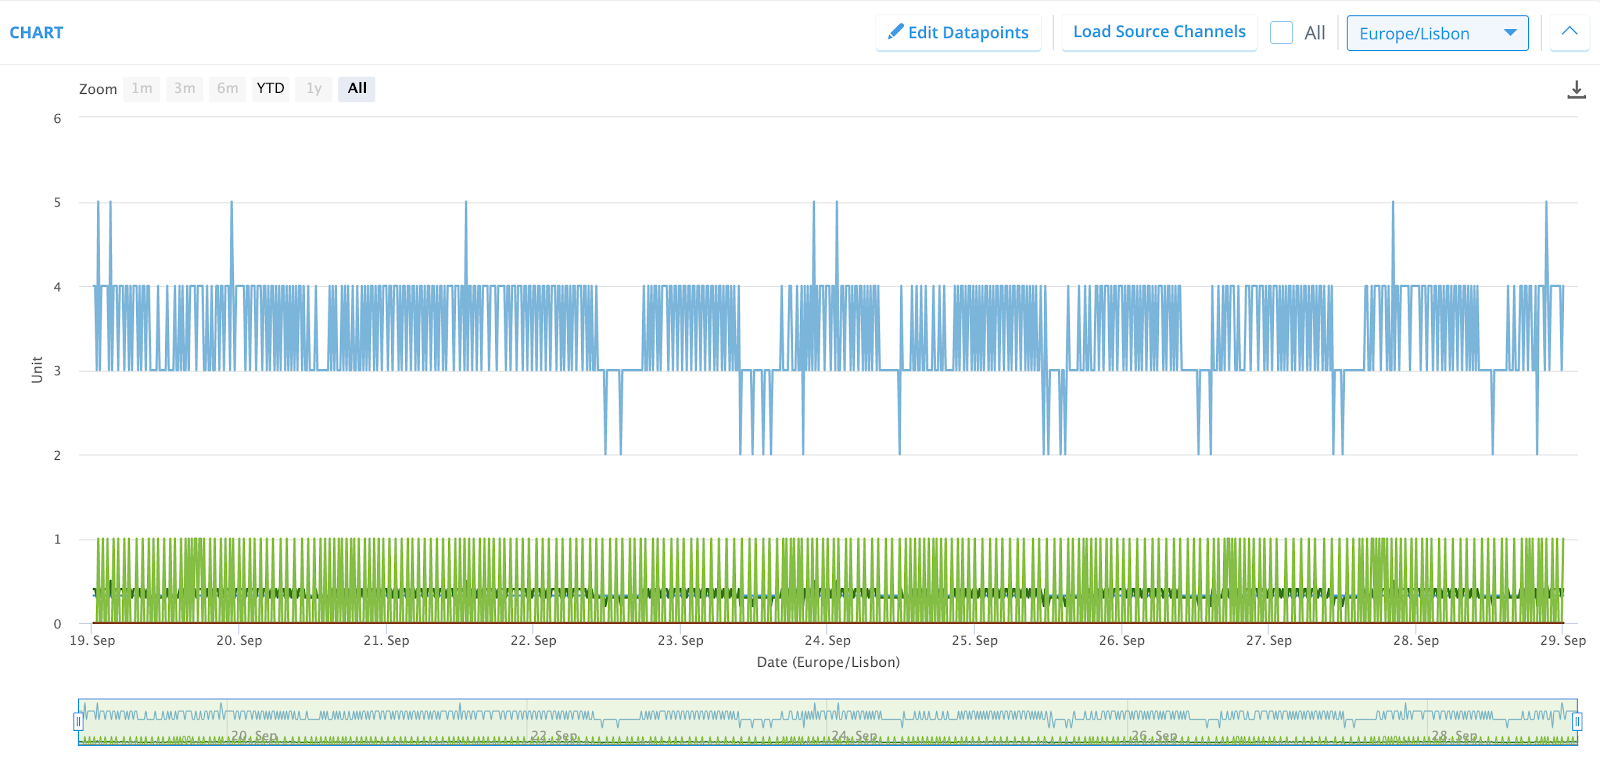
Chart
The Chart section displays a linear chart of the output on the Datasource. Additionally, you can edit datapoints, annotations and load source channels in this view, next to downloading the chart in four different formats.
Click the [Edit Datapoints] button to modify your Datapoints. A new pane will appear, with the graph, the legend and the table on the left side. Simply navigate to where you need the modification on the graph and click it. Fill in the new value in the field below and click [Apply]. On the right side of the pane you’ll see the modifications overview, which enables you to undo any changes or confirm your actions.
By default, the flow(s) that ran for this datasource will be triggered again after clicking [Apply]. Click [Change flow] when a different flow needs to be triggered, or clear the check-box(es) when triggering the flow(s) isn’t needed.
Navigate to the table on the left side of the pane to modify Annotations. The fields that are editable are highlighted in blue. Simply click on the field that needs to be modified, and a new window will appear. The dropdown menu in the Properties segment allows you to make the changes you need. Just click [Apply] in the top right corner when you’re done.
[Please note, the namespace properties determine if the Channel properties can be altered or not. If dropdown menus remain greyed out, the annotations can’t be changed afterwards.]
Click the [Load Source Channels] button to load corresponding Source Channels into the chart. A new pane appears on the right side of the screen, enabling you to select the Source Channels you need. Simply click [Load Channel(s)] when you’re done.
Live Flags (Beta)
⚠️Live flags are a beta feature which is only available through the new console. You can enable beta features in your user properties.
Live flags can be used to visualize Datapoint Attributes (DPA) values in the front end. For instance, if you would like to see all estimated values in a validated channel. The following steps are needed to set up a live flag:
-
Go to [Live Flags] under the
Smart Integrationtab in the menu -
Click [Add flag]
-
Fill in the technical name and display name (the description field is optional).
-
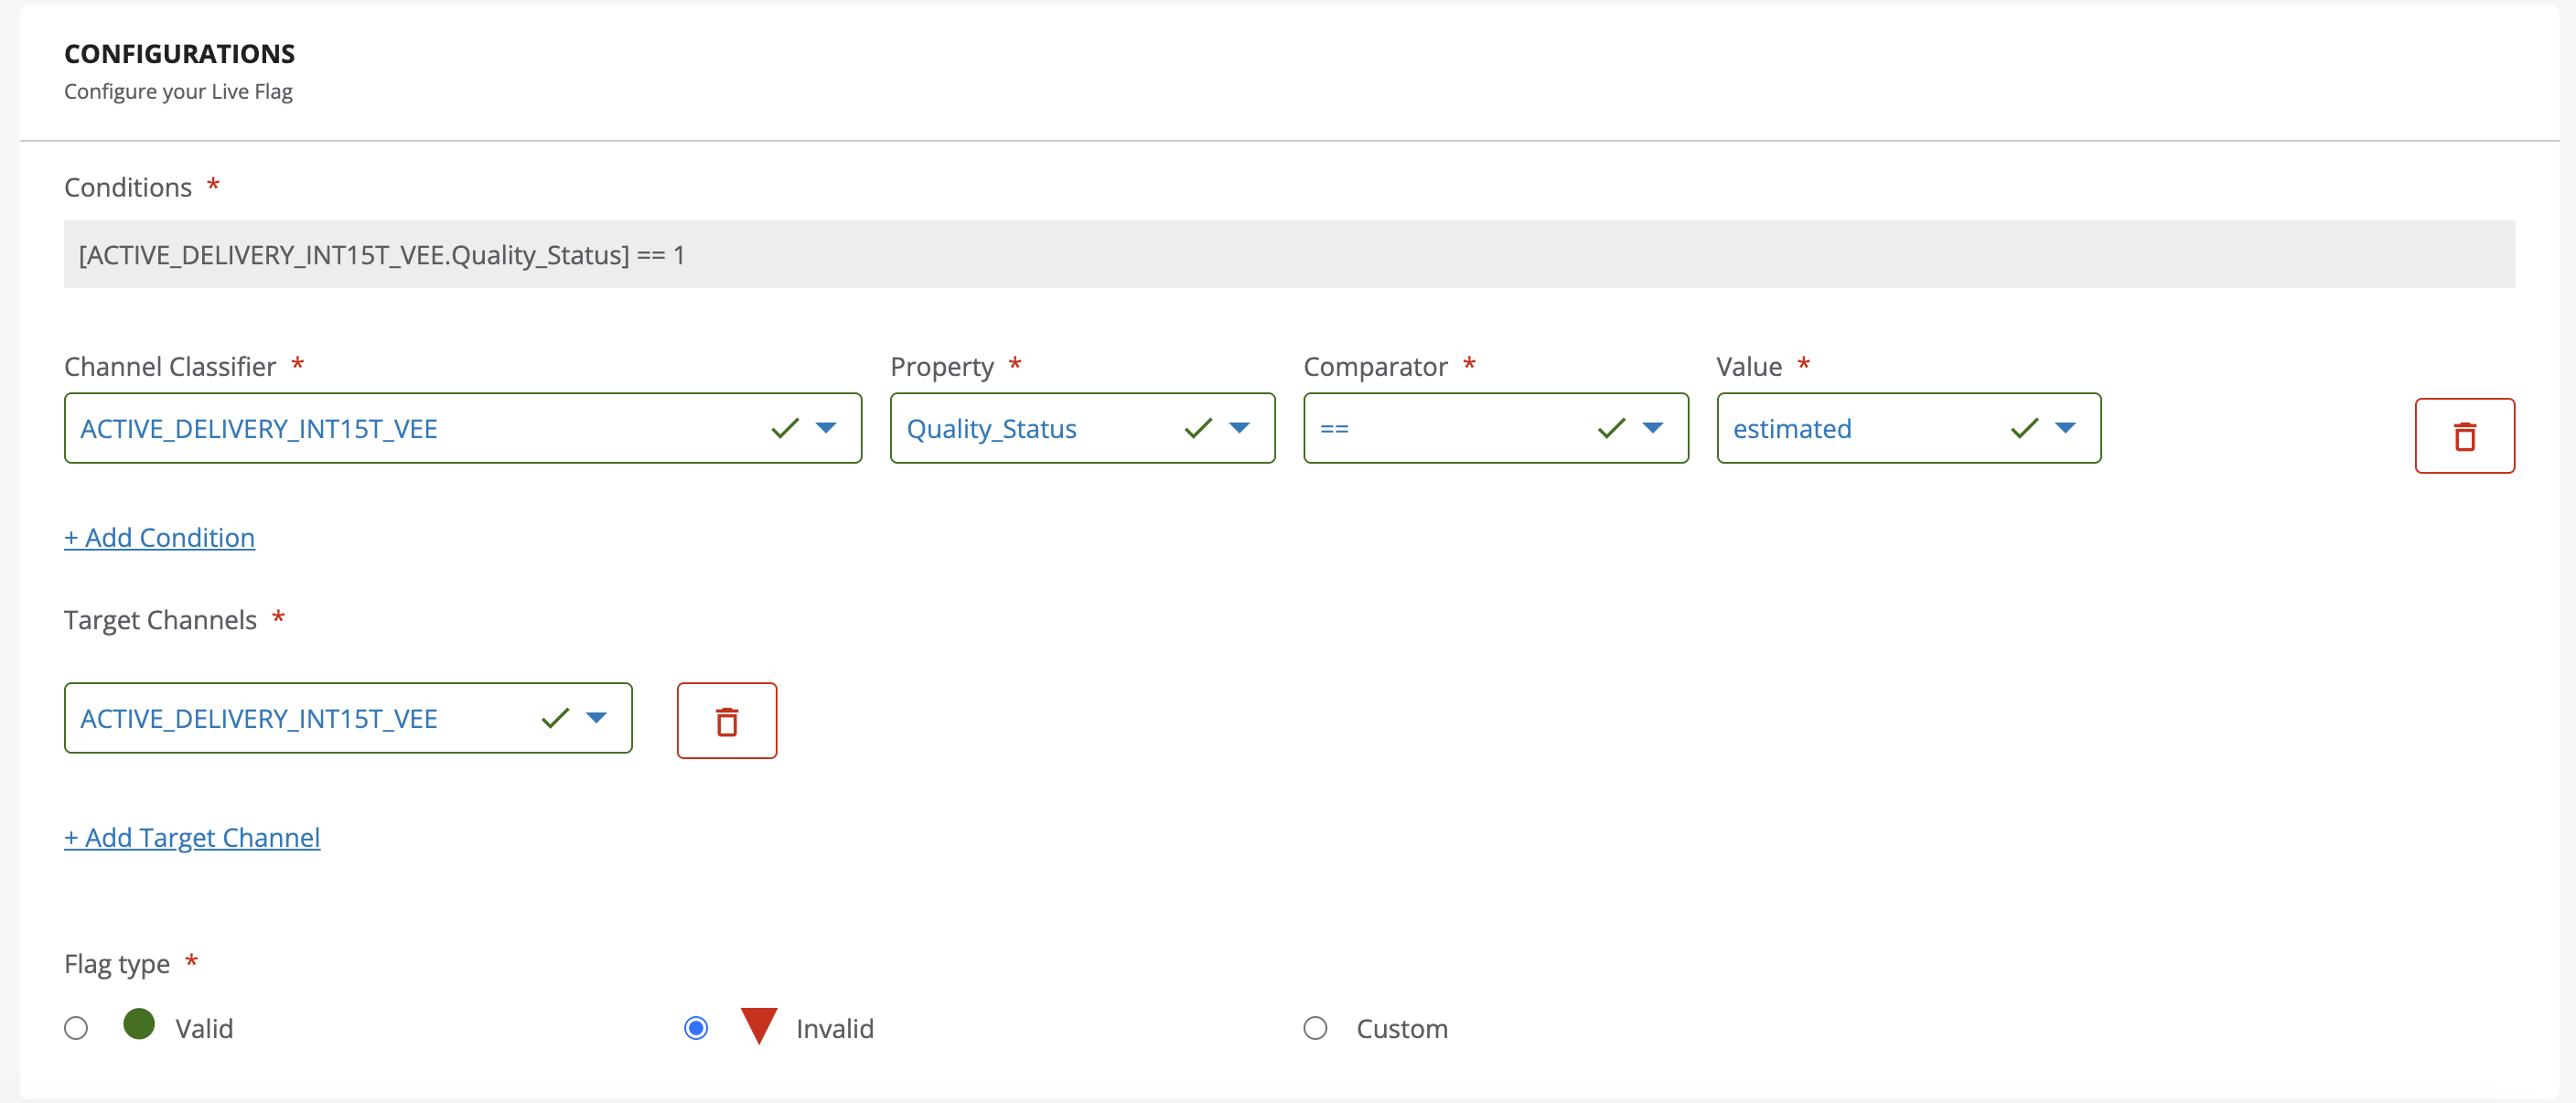
Click [Add condition] to define when the flag should trigger:
- Channel Classifier: Select the relevant classifier from the dropdown.
- Property: Choose the specific DPA property to monitor.
- Comparison: Select your operator (e.g., >, <, or =).
- Value: Enter a manual value or select one from the provided dropdown menu.
Supported condition types
A condition can be based on a plain value or on a DPA. However, not all DPA types are supported. The following DPA types can be used in conditions:
DPA type Supported in conditions Enum (Predefined value / Symbol) Yes Float Yes Long (integer) Yes Timestamp No — not implemented Boolean No — not implemented If a DPA of type Timestamp or Boolean is selected as a condition property, it will not behave as expected. These types were never implemented for condition evaluation in live flags. Use only Enum, Float, or Long DPA types for conditions.
Note: You can repeat Step 4 to layer multiple conditions for complex logic
-
Add a target channel to which the condition will cause visualizations to show up for
-
Choose the flag type, this will define how the points are visualized in the front end
-
Click [Save]
In the example above, where we want to visualise estimated values, this is what the conditions look like
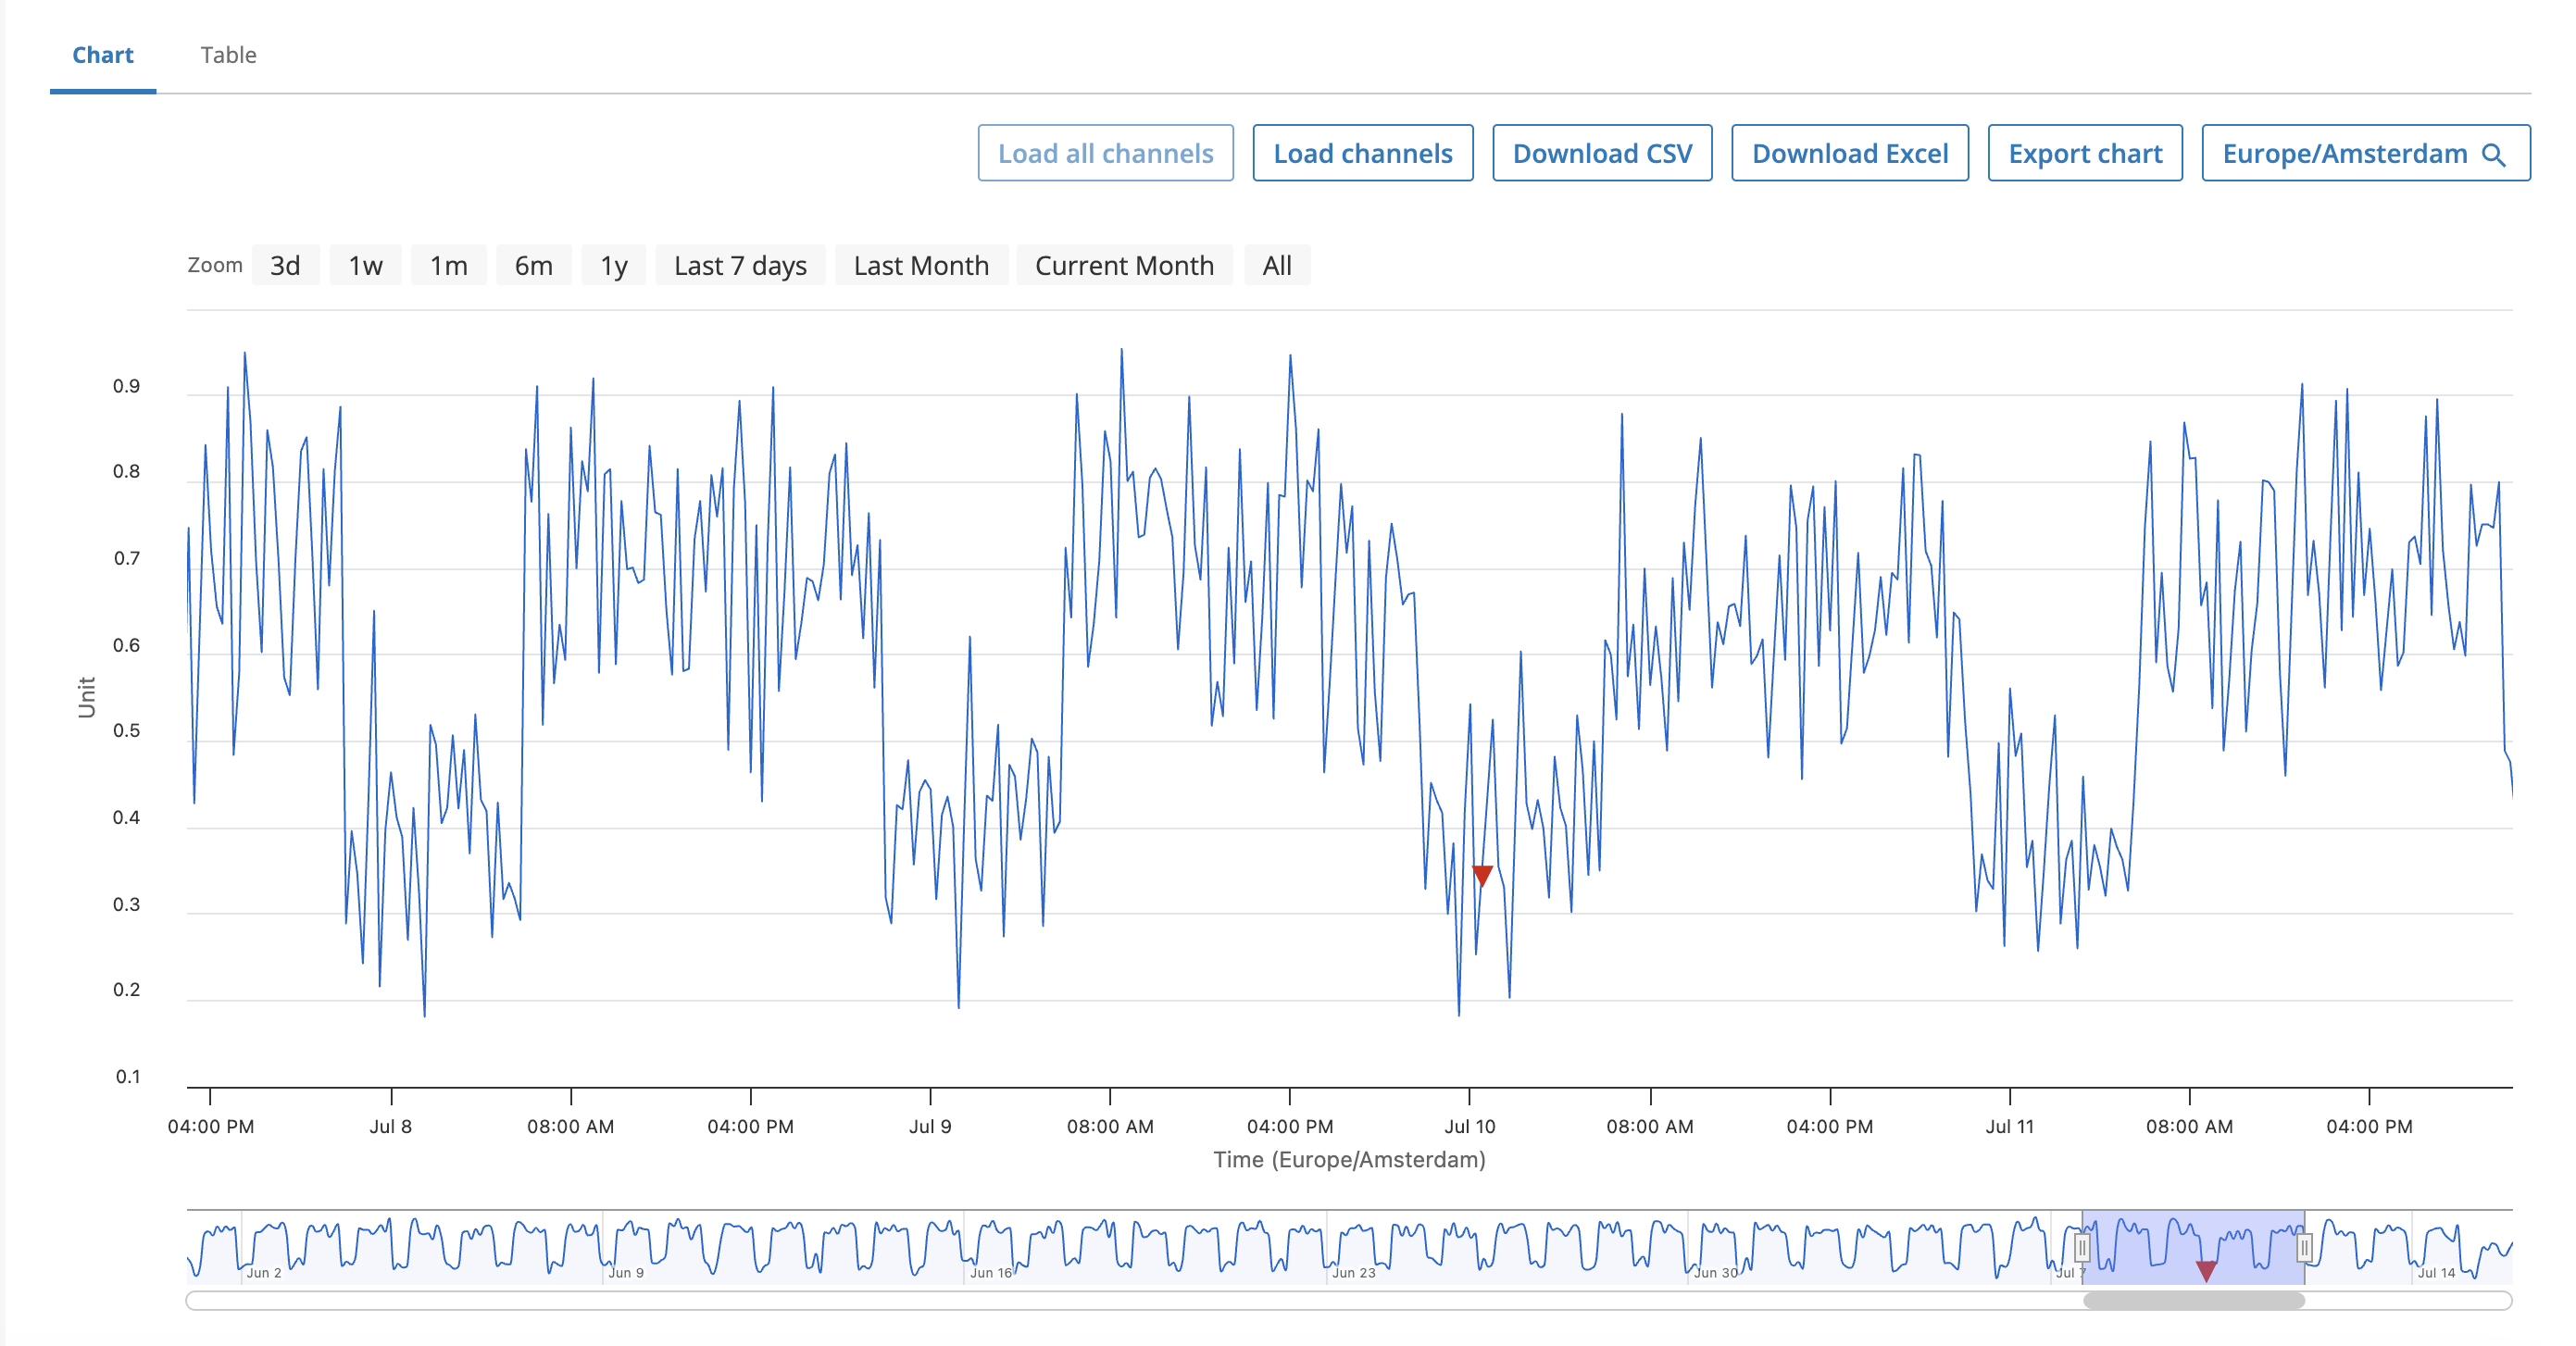
Once these configurations are set up, you can easily visualize the DPAs in the datasource view by clicking [Show Flags] in the legend.
To hide the vizualization, click [Hide Flag].
Note: switching between these will reload the most recent channels saved, so you may need to reload channels onto the graph.
This is what the vizualization looks like:
Can't find a Channel?
In case the selected Source Channels are not visible on the chart, there isn’t any available data (yet) to display.
How to set default visible channels
The default visible channels can be used to display only a select set of channels in the channel and flow view in a datasource. This is useful when datasources have many channels, and displaying them all at once creates an overload of information in the graph.
There are two places you can set the default visible channels: in the user settings and in the namespace settings. Namespace****settings are applied to all the users in a namespace, whereas user settings are applied only to your user. User default visible channels take precedent over namespace default visible channels. This means that the user can overwrite the namespace setting and choose their own default visible channels.
User Default Visible Channels
To add your own default visible channels you:
- Go to User Settings
- Expand the Default Visible Channels tab
- Click add
- Select a channel classifier which you want to see by default
- Repeat steps 3 and 4 until all channels you want have been added
- Click save
Here's an example:
Namespace Default Visible Channels:
To add namespace wide default visible channels you:
- Go to Namespace Properties
- Expand the Default Visible Channels tab
- Click add
- Select a channel classifier which you want to see by default
- Repeat steps 3 and 4 until all channels you want have been added
- Click save
Here's an example:
No data displayed if no default visible channels present in datasource
When none of the default visible channels exist in a datasource, no channel will be displayed on the graph.
For instance:
Table
The Table section displays an interactive table containing all the time series data. The table allows you to drag and drop columns so you can easily group your data. Simply click the [Reset] button when you want to undo your changes.